Manochitra Loganathan
Portfolio

Skilled in SQL, Oracle & DB2 Database, Advanced SQL queries, Power BI , Python , R programming , Advanced Excel and Tableau
@manochitra-loganathan-Linkedin
.

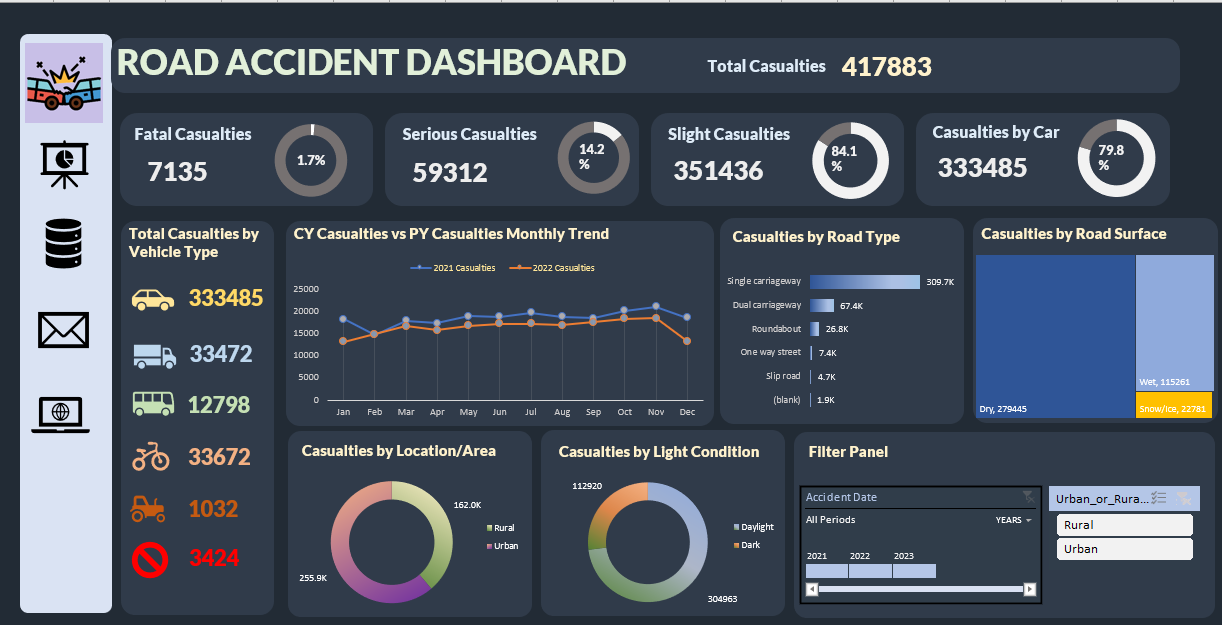
Road Accident Dashboard in Excel

In this project I have built an interactive dashboard in Excel for Road accidents for year 2021 and 2022 covering all phases of data analysis.
1. Requirement gathering- Primary and Secondary KPI
2. Data extraction - From various sources
3. Data Preparation including data cleaning.
3. Data processing - Including calculated columns to support analysis.
4. Data Analysis - Including Pivot Analysis.
5. Data Visualization - Including Dashboard prepartion using Excel.

Interactive Dashboard in Excel

In this project we cleaned bike sales data in Excel by following steps.
1. Cleaning duplicates and Formating data with replace shortcuts with meaningful data.
2. Included age brackets for data classification.
3. Prepared Pivot tables with line and Bar charts for analysis on bike sales with respect to age , salary and multiple pther factors.
4. Developed interactive Dashboard to view all information in consolidated view along with slicers.

Location

Chennai
Tamil Nadu, India - 600054

Phone

(+91) 9884824245

Email

manochitra.analyst@gmail.com

Social